Founder of ACLP’s new Quality & Safety SIG, David Kroll, MD, director of quality and safety for the Psychiatry Department at Brigham and Women’s Hospital, leads new thinking on business issues in occasional articles for ACLP News.
Statistical Chart Helps Manage Staffing Levels
 David Kroll, MD
Adequately staffing psychiatry C-L services is critical to the success of hospital systems. Up to 40% of medical inpatients have psychiatric diagnoses, and C-L psychiatrists are needed not only to provide expert care for the ones with overt symptoms but also to help hospital teams manage behavioral health at the population level (including screening, policy development, etc.). This doesn’t even include teaching obligations.
Benchmarks for staffing a psychiatry C-L service, for example on the basis of total hospital beds or yearly consult volume, have been suggested, and members of a recently formed ACLP task force on business benchmarking plan to address this.
Meanwhile, an expanding role for integrated care and proactive psychiatry consultation models may also facilitate staffing growth in the coming years. But until that happens, how does a psychiatry C-L service director know whether there’s enough staff to cover the needs of the hospital in the next month?
Consult volume varies day by day, and it’s easy to mismatch this with staff availability when staffing must be determined in advance. Overstaffing wastes resources, dilutes productivity, and can lead to unnecessary frustration (for example, when vacation requests are denied). Understaffing, on the other hand, means not being available for patients.
In fact, short-term daily consult volume can be predicted—to an extent. Assuming that no major disruptions (such as a nearby psychiatric hospital closing, or a local volcanic eruption) are anticipated, the number of consults per day (or per shift) will almost always fall within a predictable range.
An easy way to illustrate this is to use a statistical process control chart, which is a tool that plots historical outcomes on an X-Y axis and calculates the maximum and minimum values that could be expected in the future under similar circumstances.
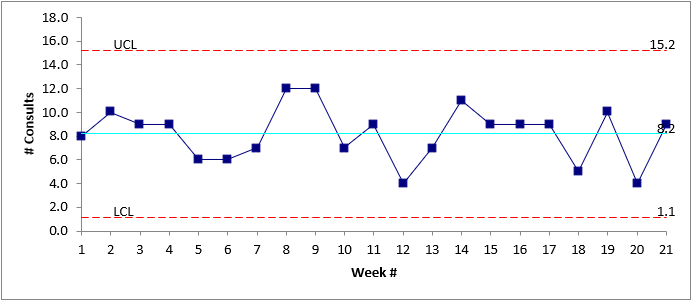
As an example, my institution (a relatively large one) plotted the number of new psychiatry consults assigned on Fridays over an approximately five-month period:

The blue line in the middle is the mean (8) and the red lines marked “UCL” and “LCL” are the Upper Control Limit (15.2) and Lower Control Limit (1.1), respectively.
From UCL and LCL alone, we can tell that it would be rare to receive >15 or <1 consult(s) on a typical Friday. Therefore, two psychiatrists on staff should expect to see between 0-8 consults (avg 4) each on a Friday; three psychiatrists, 0-5 (avg 2-3); and four psychiatrists, 0-4 (avg 2).
Depending on the psychiatrists’ other responsibilities, eight consults may be too many or may be appropriate. One could also break this down by the half-day, the shift, or even the hour.
Our group used this model specifically to improve our allocation of existing staff resources, rather than to plan for the long-term needs of our hospital system.
Historical consult volume may not always reflect need, and thus it should not be used on its own to direct hiring decisions. But it may help C-L psychiatry service directors manage productivity problems, and—just as important—vacation requests.
Also see Dr. Kroll’s first business issues article for ACLP News, Love ’em, or Hate ‘em. Dr. Kroll argued that it’s better for C-L psychiatrists to set C-L metrics than someone who doesn’t have the same understanding.


